텐서플로 첫걸음
코딩관련깃허브
안녕하세요. 팀 언플(Team Unsolved Problem)에 에디터 ㅋ헬 킴(Khel Kim), 김현호입니다.
오늘 포스팅은 텐서플로를 시작하기 좋은 책 ‘텐서플로 첫걸음’을 공부하겠습니다.
그럼, 시작하겠습니다!
기본설정
### 기본설정
import tensorflow as tf ## 배워보자!!!
import numpy as np
import matplotlib.pyplot as plt

def reset_graph(seed=42): ## 뒤에서 설명하겠습니다.
    tf.reset_default_graph()
    tf.set_random_seed(seed)
    np.random.seed(seed)
이 책에서는 텐서플로를 사용하는 방법을 아는 것이 목적입니다. 따라서 이론보다는 실습 위주로 공부하겠습니다.
또, 설치하는 방법은 생략하겠습니다.
텐서플로에서 3 * 3 연산을 하려면 다음과 같은 코드를 작성해야 합니다.
reset_graph()

a = tf.placeholder("float")
b = tf.placeholder("float")

y = tf.multiply(a, b)

sess = tf.Session()

print(sess.run(y, feed_dict={a: 3, b: 3}))
sess.close()
코드가 길죠? ㅎㅎ… 텐서플로는 연산을 하기 위해 ‘노드’라는 개념이 필요합니다. 위에 코드에서 a, b, y가 노드입니다. 이 노드는 숫자나 데이터가 될 수도 있고, 연산이 될 수도 있습니다. a, b, y를 노드로 선언하면, ‘텐서보드’(Hands-on 포스팅에서 다룹니다)에 노드들이 나타납니다. 하지만 일반적인 코딩과 다른 점이 있습니다. 만약 우리가 a = tf.placeholder(‘float’)를 다시 선언하면 텐서보드의 a_1라는 변수가 또 생깁니다. 전에 있던 변수가 대체되지 않는 것이죠. 따라서 마구잡이로 변수들을 선언하면 텐서보드에 변수들이 쌓여갑니다. 이러한 변수들을 없애주기 위해 reset_graph() 함수가 필요합니다. reset_graph() 함수 안에는 tf.reset_default_graph()라는 함수가 있는데 이 함수가 텐서보드를 초기화해주는 함수입니다.
또, 연산을 하기 위해서는 tf.Session()이라는 코드가 필요합니다. 지금부터 연산을 하겠다는 선언같은 코드입니다. ‘세션을 열었다’라고 생각할 수도 있습니다. tf.Session()으로 세션을 열고 y라는 연산을 작동 시킵니다. y를 실행시키면 y와 관련된 애들(a, b)가 실행됩니다. feed_dict은 이 a와 b에 어떤 값을 넣을지 알려주는 딕셔너리입니다.
지금 보면 연산이 매우 귀찮고 어려워보입니다. 하지만 텐서플로는 이런 간단한 연산보다, 복잡한 연산에서 빛을 봅니다. 머신러닝에 복잡한 연산에서 있어서 최적값을 찾기위한 미분은 보통 어려운 일이지만 텐서플로는 이 작업을 매우 효율적으로 합니다. 이러한 점이 텐서플로를 계속 사용하게 하는 요소입니다.
텐서플로에서 사용할 수 있는 연산들을 알아보겠습니다.
tensorflow operations
tf.add(x, y)
tf.subtract(x, y)
tf.multiply(x, y)
tf.truediv(x, y)
tf.mod(x, y)
tf.abs(x)
tf.negative(x)
tf.sign(x)
tf.reciprocal(x) ## 역수 tf.reciprocal(3) = 1/3
tf.square(x)
tf.round(x) ## 반올림 값
tf.sqrt(x) ## 제곱근
tf.pow(x, y) ## 거듭제곱
tf.exp(x) ## 지수 값 y = e^x
tf.log(x) ## 로그 랎 y = log_e(x)
tf.maximum(x)
tf.minimum(x)
tf.cos(x)
tf.sin(x)
행렬 연산
tf.daig
tf.transpose
tf.matmul
tf.matrix_determinant
tf.matrix_inverse
reset_graph()

a = tf.diag([1,2,3,4,5])

sess = tf.Session()
print(sess.run(a))
sess.close()
with tf.Session() as sess:
t = a.eval()
t
연산에 대해서 알아봤으니 텐서플로를 이용해 선형회귀를 해보도록 하겠습니다.
일단 데이터를 만들어보겠습니다.
num_points = 1000
vectors_set = []
for i in range(num_points):
    x1 = np.random.normal(0.0, 0.55)
    y1 = x1 * 0.1 + 0.3 + np.random.normal(0.0, 0.03)
    vectors_set.append([x1, y1])

x_data = [v[0] for v in vectors_set]
y_data = [v[1] for v in vectors_set]

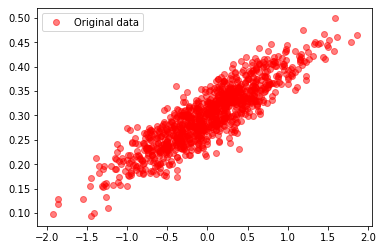
plt.plot(x_data, y_data, 'ro',label ='Original data', alpha=0.5)
plt.legend()

만약 선형회귀가 잘된다면 기울기는 0.1, 절편은 0.3으로 예측할 것입니다.
reset_graph()

### 1 = 랜덤 숫자 개수
W = tf.Variable(tf.random_uniform([1], -1.0, 1.0))
b = tf.Variable(tf.zeros([1]))

y = W * x_data + b ## 기본적인 연산은 이렇게 사용할 수도 있음

loss = tf.reduce_mean(tf.square(y - y_data))
## reduce_mean 차원을 줄이면서 계산함
## axis를 통해 축을 결정해줄 수 있음

optimizer = tf.train.GradientDescentOptimizer(0.5)
train = optimizer.minimize(loss)

init = tf.global_variables_initializer()
## 텐서플로는 C기반이기 때문에 변수 초기화를 선언해주어야 함
## 변수보다 아래에 정의되어야 함

with tf.Session() as sess:
    init.run()

    for step in range(8):
        sess.run(train)
        print(step, W.eval(), b.eval())
        print(step, loss.eval())

        print(W.eval(), b.eval())
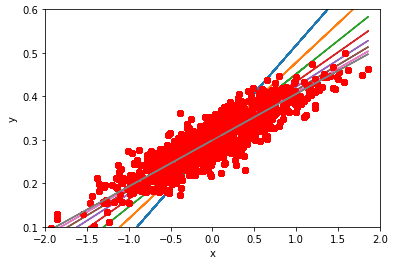
        plt.plot(x_data, y_data, 'ro')
        plt.plot(x_data, W.eval() * x_data + b.eval())
        plt.xlabel('x')
        plt.xlim(-2,2)
        plt.ylim(0.1,0.6)
        plt.ylabel('y')
## result
0 [0.21968451] [0.29769766]
0 0.0056924094
[0.21968451] [0.29769766]
1 [0.17965192] [0.2981866]
1 0.0030199895
[0.17965192] [0.2981866]
2 [0.15293868] [0.29853544]
2 0.0018300107
[0.15293868] [0.29853544]
3 [0.13511308] [0.2987682]
3 0.001300134
[0.13511308] [0.2987682]
4 [0.12321815] [0.2989235]
4 0.0010641895
[0.12321815] [0.2989235]
5 [0.11528074] [0.29902714]
5 0.000959128
[0.11528074] [0.29902714]
6 [0.10998415] [0.29909632]
6 0.000912346
[0.10998415] [0.29909632]
7 [0.10644977] [0.29914245]
7 0.0008915149
[0.10644977] [0.29914245]

텐서플로는 tf.train.GradientDescentOptimizer도 연산처럼 생각합니다.
텐서플로 선형회귀도 잘 예측했습니다.
텐서플로를 사용할 때 변수를 선언하는 방법은 3가지가 있습니다.
텐서플로에서 변수는 보통 텐서라고 부릅니다.

업데이트는 세션이 실행 중에 나오는 새로운 값(그래디언트 디센트로 인한 기울기와 절편의 새로운 값 등)을 그에 해당하는 변수에 다시 집어 넣는다는 것입니다.
텐서는 보통 numpy array처럼 shape를 가지고 있습니다. 따라서 그와 관련된 함수를 사용할 수 있습니다.
tensor 관련된 함수
tf.shape
tf.size
tf.rank
tf.reshape
tf.squeeze
tf.expand_dims
tf.slice
tf.split
tf.tile
tf.concat
tf.reverse
tf.transpose
tf.gather
reset_graph()

vectors = tf.constant([[1,2,3,4],[5,6,7,8]])
expanded_vectors = tf.expand_dims(vectors, 0)
## 두번째 인자는 추가하는 차원의 위치
## 2가 필요없는 이유가 텐서를 그냥 늘리면 되기 때문인듯
## ex) tf.concat으로

print(expanded_vectors.get_shape())
상수를 생성할 수 있는 여러가지 도구들
tf.zeros_like
tf.ones_like
tf.fill
tf.constant

tf.random_normal 정규 분포 형태를 갖는 난수 텐서
tf.truncated_normal 2표준편차 밖에 있는 값은 제외한 정규 분포 형태를 갖는 난수 텐서
tf.random_uniform 균등 분포 형태의 난수 텐서를 생성
tf.random_shuffle 첫번째 차원을 기준으로 하여 텐서의 엘리먼트를 섞음
tf.set_random_seed 난수 시드를 제공
reset_graph()

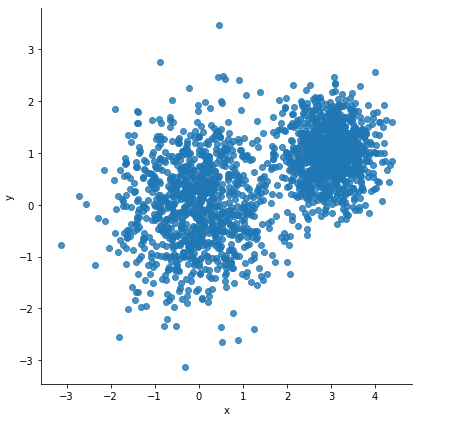
num_puntos = 2000
conjunto_puntos = []
for i in range(num_puntos):
    if np.random.random() > 0.5:
        conjunto_puntos.append([np.random.normal(0.0, 0.9),
                               np.random.normal(0.0, 0.9)])
    else:
        conjunto_puntos.append([np.random.normal(3.0, 0.5), np.random.normal(1.0, 0.5)])
import pandas as pd
import seaborn as sns

df = pd.DataFrame({"x": [v[0] for v in conjunto_puntos],
                  "y": [v[1] for v in conjunto_puntos]})
sns.lmplot("x", "y", data=df, fit_reg=False, size=6)

## kmeans!!
vectors = tf.constant(conjunto_puntos)
k = 4
centroides = tf.Variable(tf.slice(tf.random_shuffle(vectors),[0,0],[k,-1]))
##centroides는 2차원 배열인데 이 것을 섞고 그 중 0,0 부터 3,1까지 가져옴
expanded_vectors = tf.expand_dims(vectors, 0) ##2000개
expanded_centroides = tf.expand_dims(centroides, 1) ## 4개
##브로드캐스팅을 위해서

diff = tf.subtract(expanded_vectors, expanded_centroides)
sqr = tf.square(diff)
distances = tf.reduce_sum(sqr, 2) ## 2는 axis
assignments = tf.argmin(distances, 0) ## 0는 axis
참고 tf.reduce_sum처럼 텐서의 차원을 감소시키는 수학연산들
tf.reduce_sum
tf.reduce_prod
tf.reduce_min
tf.reduce_max
tf.reduce_mean
가장 작거나 큰 값의 인덱스를 리턴하는 함수
tf.argmin
tf.argmax
다시 돌아와서
means = tf.concat([tf.reduce_mean(tf.gather(vectors, tf.reshape(tf.where(tf.equal(assignments, c)),
          [1, -1])), reduction_indices=[1]) for c in range(k)], 0)

updata_centroides = tf.assign(centroides, means)

init = tf.global_variables_initializer()

with tf.Session() as sess:
    init.run()
    for step in range(100):
        _, centroid_values, assignment_values = updata_centroides.eval(), centroides.eval(), assignments.eval()
print(centroid_values)
## result
[[-0.2298521   0.77452445]
 [-0.6850132  -0.7251269 ]
 [ 0.8395793  -0.3271611 ]
 [ 2.9674554   1.0131391 ]]
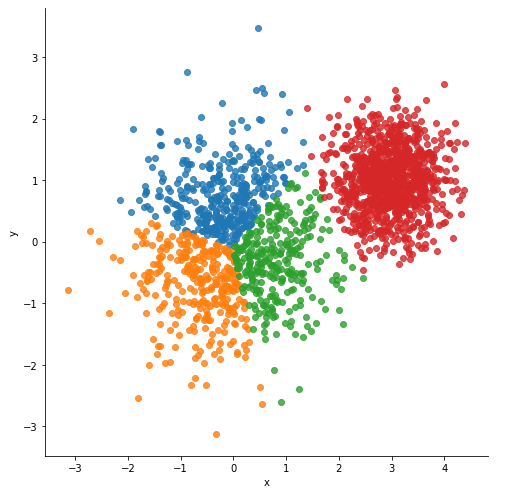
data = {"x": [], "y": [], "cluster": []}
for i in range(len(assignment_values)):
    data["x"].append(conjunto_puntos[i][0])
    data["y"].append(conjunto_puntos[i][1])
    data["cluster"].append(assignment_values[i])
df = pd.DataFrame(data)
sns.lmplot("x", "y", data=df,
           fit_reg=False, size=7,
           hue="cluster", legend=False)

reset_graph()

from tensorflow.examples.tutorials.mnist import input_data
mnist = input_data.read_data_sets("MNIST_data/", one_hot=True)
tf.convert_to_tensor(mnist.train.images).get_shape()
## result
TensorShape([Dimension(55000), Dimension(784)])
W = tf.Variable(tf.zeros([784,10]))
b = tf.Variable(tf.zeros([10]))

x = tf.placeholder("float", [None, 784])
y = tf.nn.softmax(tf.matmul(x,W) + b) ## 예측값의 소프트맥스
y_ = tf.placeholder("float", [None, 10])
cross_entropy = -tf.reduce_sum(y_ * tf.log(y))
train_step = tf.train.GradientDescentOptimizer(0.01).minimize(cross_entropy)
init = tf.global_variables_initializer()

with tf.Session() as sess:
    init.run()
    for i in  range(1000):
        batch_xs, batch_ys = mnist.train.next_batch(100)
        train_step.run(feed_dict={x: batch_xs, y_: batch_ys})
        correct_prediction = tf.equal(tf.argmax(y,1), tf.argmax(y_,1))
        accuracy = tf.reduce_mean(tf.cast(correct_prediction, "float"))
        if i % 100 == 0:
            print(accuracy.eval(feed_dict={x: mnist.test.images, y_:mnist.test.labels}))
## result
0.4749
0.8946
0.9041
0.9018
0.909
0.9042
0.9088
0.896
0.9138
0.9183
텐서플로 첫걸음 포스팅은 개념적으로 파악하는 것보다 텐서플로를 사용해보는 것에 초점을 맞춰봤습니다. 개념적인 부분은 핸즈온을 공부하면서 체크해보도록 하겠습니다.