핸즈온 머신러닝
코딩관련깃허브
Author : Duck Hyeun, Ryu
안녕하세요. 팀 언플(Team Unsolved Problem)에 에디터 ㅋ헬 킴(Khel Kim), 김현호입니다.
오늘은 지난 시간 ‘Ch 5. SVM’에 이어서 ‘Ch 6. Decision Tree’에 들어가겠습니다.
[Hands-on ML] Chapter 5. Support Vector Machine
그럼, 시작하겠습니다!
기본설정
# 공통
import numpy as np
import os

# 일관된 출력을 위해 유사난수 초기화
np.random.seed(42)

# 맷플롯립 설정
%matplotlib inline
import matplotlib
import matplotlib.pyplot as plt
plt.rcParams['axes.labelsize'] = 14
plt.rcParams['xtick.labelsize'] = 12
plt.rcParams['ytick.labelsize'] = 12

# 한글출력
matplotlib.rc('font', family='NanumBarunGothic')
matplotlib.rcParams['axes.unicode_minus'] = False

# 작업할 디렉토리
PROJECT_ROOT_DIR = "C:\\Python\\MLPATH" ##파이썬 디렉토리 저장
CHAPTER_ID = "decision_trees"
IMAGE_PATH = os.path.join(PROJECT_ROOT_DIR, "images", CHAPTER_ID)

def image_path(fig_id, image_path_k2h=IMAGE_PATH):
    return os.path.join(image_path_k2h, fig_id) ##사진을 저장할 위치
결정트리는 분류와 회귀 작업 그리고 다중출력 작업도 가능한 머신러닝 모델입니다. 복잡한 데이터셋도 학습할 수 있고, 랜덤 포레스트의 기본 구성 요소입니다.
6장에서는 훈련, 시각화, 예측 방법, CART 훈련 알고리즘, 규제, 회귀 문제에 적용, 제약사항등을 살펴보겠습니다.
4장에서 사용한 붓꽃 데이터셋으로 DecisionTreeClassifier를 훈련 시켜보겠습니다.
from sklearn.datasets import load_iris
from sklearn.tree import DecisionTreeClassifier

iris = load_iris() ##모듈 안 load_iris는 function으로 정의되어있고, 함수를 불러야 데이터 Bunch를 얻을 수 있음.

X = iris.data[:, 2:] ## data attiribute: [sepal length, sepal width, petal legth, petal width] ## 꽃받침, 꽆잎
y = iris.target
잠시 Bunch 자료형에 대해서 알아보겠습니다.
print(type(iris))
## 결과
<class 'sklearn.utils.Bunch'>
Bunch 자료형은 사이킷런에 내장되어있는 자료형으로서 파이썬의 기본 자료형인 딕셔너리와 거의 비슷하게 사용됩니다. 차이가 있다면, 파이썬 자료형인 딕셔너리에서는 value값을 dic[‘key_name’]으로 구해야 했다면, Bunch 자료형은 bunch[‘key_name’]과 bunch.key_name으로 구할 수 있습니다.
print('\n', iris.data.shape) ##데이터 개수와 특징 개수 확인
print('\n \n', iris.DESCR) ##Bunch안에 이 데이터가 어떤 데이터인지 알려주는 key와 value가 있음
우리의 결정트리를 훈련시켜보겠습니다.
tree_clf = DecisionTreeClassifier(max_depth=2)
##사용하려는 모델을 정의하고
tree_clf.fit(X, y)
##우리가 가진데이터를 집어 넣음
끝입니다!! ㅋㅋㅋㅋㅋㅋ 쉽죠? 결정트리의 강점 중 하나는 훈련된 결정트리를 시각화 할 수 있습니다. 보통 머신러닝 모델의 내부는 블랙박스 취급을 합니다. 즉, 우리 모델이 어째서 결과를 이렇게 저렇게 도출했는지 알 수 없다는 것입니다. 하지만 결정트리는 화이트박스라 하여 어째서 결정트리가 이렇게 저렇게 판단했는지 알 수 있다는 것입니다.
##개인적으로 홈 디렉터리를 바꿔서 책에 있는 코드가 적용되지 않음
##따로 만듦
from sklearn.tree import export_graphviz
def export_graphviz_k2h(ML_algorithms, image_path_k2h=IMAGE_PATH):
    if not os.path.isdir(image_path_k2h):#github 코드로는 작동이 안되서
        os.makedirs(image_path_k2h) ##직접 image 폴더, decision_trees 폴더를 만듦
    export_graphviz(
    ML_algorithms,
    out_file=image_path("iris_tree.dot"), ##C:\Python\image\decisiontrees\iris_tree.dot
    feature_names=iris.feature_names[2:],
    class_names=iris.target_names,
    rounded=True, ##박스 생김새
    filled=True ##박스 생김새
        )

export_graphviz_k2h(tree_clf) ##dot 파일을 만들어줌
여기서 graphviz 프로그램을 따로 다운로드 하셔야합니다. 책에서는 명령 프롬프트에서
dot -Tpng iris_tree.dot -o iris_tree.png
를 실행해서 png 파일을 만들지만, 위에 박해선 번역가님 깃허브에 있는 쥬피터 노트북에서 png파일을 바로 볼 수 있는 코드가 있습니다.
import graphviz
with open("images/decision_trees/iris_tree.dot") as f:
    dot_graph = f.read()

dot = graphviz.Source(dot_graph)
dot.format = 'png'
dot.render(filename='iris_tree', directory='images/decision_trees', cleanup=True)
dot ##시스템 변수, PATH에 graphviz가 있어야함
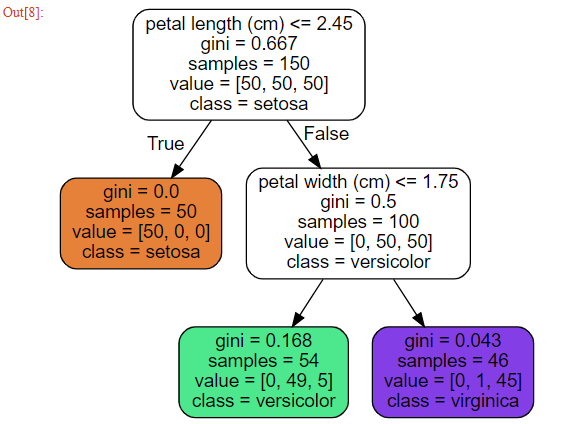
일단 결정트리에게 예측을 맡기기 전에 용어를 먼저 정리하겠습니다.
결정트리가 예측하는 방식은 다음과 같습니다.
 이번엔 박스 내부 용어를 살펴보겠습니다.
sample - 적용된 훈련 샘플의 개수
value - 그 노드에서 각 class에 있는 훈련 샘플의 개수
gini - 불순도 (gini는 불순도 측정 방식 중 하나, 엔트로피를 쓸 때도 있음, 엔트로피 방정식은 뒤에서 설명)
질문.
지니 계수는 불순도를 잘 나타내주는 지표인가?
이 질문을 해결하려면 불순도 측정 방식을 잘 정의하고(수학의 metric처럼), 그 특성을 가지고 지니 계수가 불순도를 측정하는 방식에 부합하는지를 살펴봐야 할 듯. 따라서 ‘불순한 정도를 측정한다’라는 말을 수학적으로 정의해줘야할 것같다.
from matplotlib.colors import ListedColormap

def plot_decision_boundary(clf, X, y, axes=[0, 7.5, 0, 3], iris=True, legend=False, plot_training=True):
    x1s = np.linspace(axes[0], axes[1], 100)
    x2s = np.linspace(axes[2], axes[3], 100)
    x1, x2 = np.meshgrid(x1s, x2s)
    X_new = np.c_[x1.ravel(), x2.ravel()]
    y_pred = clf.predict(X_new).reshape(x1.shape)
    custom_cmap = ListedColormap(['#fafab0','#9898ff','#a0faa0'])
    plt.contourf(x1, x2, y_pred, alpha=0.3, cmap=custom_cmap)
    if not iris:
        custom_cmap2 = ListedColormap(['#7d7d58','#4c4c7f','#507d50'])
        plt.contour(x1, x2, y_pred, cmap=custom_cmap2, alpha=0.8)
    if plot_training:
        plt.plot(X[:, 0][y==0], X[:, 1][y==0], "yo")
        plt.plot(X[:, 0][y==1], X[:, 1][y==1], "bs")
        plt.plot(X[:, 0][y==2], X[:, 1][y==2], "g^")
        plt.axis(axes)
    if iris:
        plt.xlabel("꽃잎 길이", fontsize=14)
        plt.ylabel("꽃잎 너비", fontsize=14)
    else:
        plt.xlabel(r"$x_1$", fontsize=18)
        plt.ylabel(r"$x_2$", fontsize=18, rotation=0)
    if legend:
        plt.legend(loc="lower right", fontsize=14)

plt.figure(figsize=(8, 4))
plot_decision_boundary(tree_clf, X, y)
plt.plot([2.45, 2.45], [0, 3], "k-", linewidth=2)
plt.plot([2.45, 7.5], [1.75, 1.75], "k--", linewidth=2)
plt.plot([4.95, 4.95], [0, 1.75], "k:", linewidth=2)
plt.plot([4.85, 4.85], [1.75, 3], "k:", linewidth=2)
plt.text(1.40, 1.0, "깊이=0", fontsize=15)
plt.text(3.2, 1.80, "깊이=1", fontsize=13)
plt.text(4.05, 0.5, "(깊이=2)", fontsize=11)

plt.show()
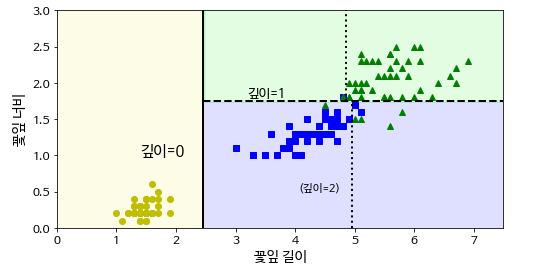
tree_clf.predict_proba([[5, 1.5]])
## 결과
array([[0.        , 0.90740741, 0.09259259]])
tree_clf.predict([[5, 1.5]])
## 결과
array([1])
CART란 Classification And Regression Tree Algorithm의 약자입니다. 먼저 훈련 세트를 하나의 특성 $k$와 임곗값 $t_k$를 사용해 두 개의 서브셋으로 나눕니다.
$k$와 $t_k$를 고르는 방식
가장 순수한(불순도가 낮은) 서브셋으로 나눌 수 있는 ($k$,$t_k$) 짝을 찾음
\(J_{k, t_k} = \frac{m_{left}}{m} G_{left} + \frac{m_{right}}{m} G_{right}\)
where $G_{left/right}$ measures the impurity of the left/right subset, and $m_{left/right}$ is the number of instances in the left/right subset.
Note. Gain함수: 특성과 임계값에 따라 얻을 수 있는 정보량
\(Gain(k) = Entropy(X) - J_{k,t_k}\)
gain함수가 높은 특성 k를 선택해야함
이와 같은 방식으로 결정트리는 서브셋의 서브셋을 또 나눕니다. 이 과정에서 max_depth에서 지정한 깊이가 되면 중지하거나 불순도를 줄이는 분할을 찾을 수 없을 때 멈추게 됩니다. 6.7 단원에서 배우는 매개변수도 중지조건에 관여하게 됩니다. 이 모델은 각 단계에서 최적의 분할을 찾기 때문에 현재 단계의 분할이 몇 단계를 거쳐 가장 낮은 불순도로 이어질 수 있을 지는 고려하지 않습니다. 다시 말해, 최적의 솔루션은 보장하지 못합니다.
criterion 매개변수를 ‘entropy’로 지정하면 엔트로피 불순도를 사용할 수 있습니다.
실제로는 지니 불순도와 큰 차이는 없습니다. 지니 불순도가 조금 더 계산이 빠르지만 지니 불순도는 가장 빈도 높은 클래스를 한쪽 가지로 고립시키는 경향이 있는 반면 엔트로피는 조금 더 균형 잡힌 트리를 만듭니다.
결정트리는 훈련 데이터에 대한 제약사항이 거의 없습니다. 따라서 제한을 따로 두지 않으면 트리가 훈련 데이터에 과대적합되기가 쉽습니다. 이 문제를 트리의 자유도를 제한해서 해결합니다.
from sklearn.datasets import make_moons
Xm, ym = make_moons(n_samples=100, noise=0.25, random_state=53)

deep_tree_clf1 = DecisionTreeClassifier(random_state=42)
deep_tree_clf2 = DecisionTreeClassifier(min_samples_leaf=4, random_state=42)
deep_tree_clf1.fit(Xm, ym)
deep_tree_clf2.fit(Xm, ym)

plt.figure(figsize=(11, 4))
plt.subplot(121)
plot_decision_boundary(deep_tree_clf1, Xm, ym, axes=[-1.5, 2.5, -1, 1.5], iris=False)
plt.title("규제 없음", fontsize=16)
plt.subplot(122)
plot_decision_boundary(deep_tree_clf2, Xm, ym, axes=[-1.5, 2.5, -1, 1.5], iris=False)
plt.title("min_samples_leaf = {}".format(deep_tree_clf2.min_samples_leaf), fontsize=14)

plt.show()
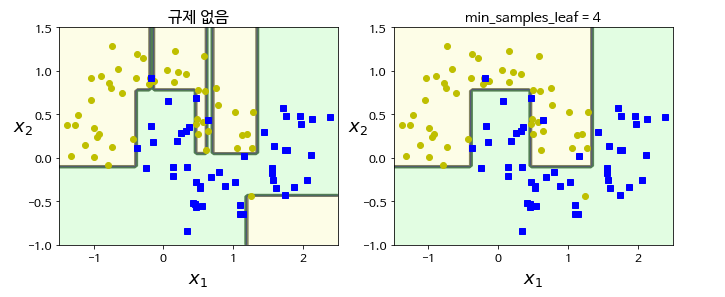
결정트리는 회귀에도 사용할 수 있습니다.
이차함수를 만들어 보겠습니다.
np.random.seed(42)
m = 200
X = np.random.rand(m, 1)
y = 4 * (X - 0.5) ** 2
y = y + np.random.randn(m, 1) / 10
회귀버전 결정트리를 가져오겠습니다.
from sklearn.tree import DecisionTreeRegressor

tree_reg = DecisionTreeRegressor(max_depth=1, random_state=42)
tree_reg.fit(X, y)
트리를 훈련시키고 그림을 그려보겠습니다.
tree_reg1 = DecisionTreeRegressor(random_state=42, max_depth=2)
tree_reg2 = DecisionTreeRegressor(random_state=42, max_depth=3)
tree_reg1.fit(X, y)
tree_reg2.fit(X, y)

def plot_regression_predictions(tree_reg, X, y, axes=[0, 1, -0.2, 1], ylabel="$y$"):
    x1 = np.linspace(axes[0], axes[1], 500).reshape(-1, 1)
    y_pred = tree_reg.predict(x1)
    plt.axis(axes)
    plt.xlabel("$x_1$", fontsize=18)
    if ylabel:
        plt.ylabel(ylabel, fontsize=18, rotation=0)
    plt.plot(X, y, "b.")
    plt.plot(x1, y_pred, "r.-", linewidth=2, label=r"$\hat{y}$")

plt.figure(figsize=(11, 4))
plt.subplot(121)
plot_regression_predictions(tree_reg1, X, y)
for split, style in ((0.1973, "k-"), (0.0917, "k--"), (0.7718, "k--")):
    plt.plot([split, split], [-0.2, 1], style, linewidth=2)
plt.text(0.21, 0.65, "깊이=0", fontsize=15)
plt.text(0.01, 0.2, "깊이=1", fontsize=13)
plt.text(0.65, 0.8, "깊이=1", fontsize=13)
plt.legend(loc="upper center", fontsize=18)
plt.title("max_depth=2", fontsize=14)

plt.subplot(122)
plot_regression_predictions(tree_reg2, X, y, ylabel=None)
for split, style in ((0.1973, "k-"), (0.0917, "k--"), (0.7718, "k--")):
    plt.plot([split, split], [-0.2, 1], style, linewidth=2)
for split in (0.0458, 0.1298, 0.2873, 0.9040):
    plt.plot([split, split], [-0.2, 1], "k:", linewidth=1)
plt.text(0.3, 0.5, "깊이=2", fontsize=13)
plt.title("max_depth=3", fontsize=14)

plt.show()
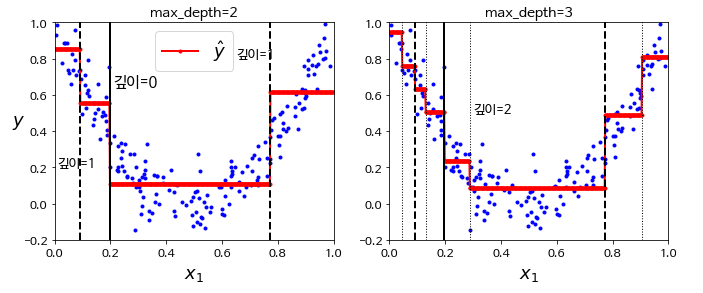
결정트리가 어떤 방식으로 판단했는지 살펴보겠습니다.
def export_graphviz_k2h(ML_algorithms, image_path_k2h=IMAGE_PATH):
    if not os.path.isdir(image_path_k2h):#github 코드로는 작동이 안되서
        os.makedirs(image_path_k2h) ##직접 image 폴더, decision_trees 폴더를 만듦
    export_graphviz(
    ML_algorithms,
    out_file=image_path("regression_tree.dot"), ##C:\Python\image\decisiontrees\iris_tree.dot
    feature_names=["x1"],
    rounded=True, ##박스 생김새
    filled=True ##박스 생김새
        )

export_graphviz_k2h(tree_reg) ##dot 파일을 만들어줌
import graphviz
with open("images/decision_trees/regression_tree.dot") as f:
    dot_graph = f.read()

dot = graphviz.Source(dot_graph)
dot.format = 'png'
dot.render(filename='regression_tree', directory='images/decision_trees', cleanup=True)
dot ##시스템 변수, PATH에 graphviz가 있어야함
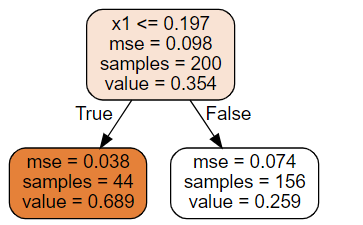
앞서 만든 분류 트리와 비슷해 보이지만, 주요한 차이는 각 노드에서 클래스를 예측하는 대신 어떤 값을 예측한다는 것입니다. 만약 $x_1$ = 0.6인 샘플을 넣게 되면, value=0.259인 leaf node에 도달하게 됩니다. leaf node에 있는 156개 훈련 샘플의 평균 타깃값으로 테스트 샘플의 값이 예측됩니다. 이 예측값을 사용해 156개 샘플에 대한 평균제곱오차(MSE)를 계산하면 0.074가 됩니다.
회귀 작업에서도 결정트리가 과대적합되기 쉬우니 유의해야 합니다.
결정 트리는 이해하고 해석하기 쉽고, 사용하기 편하고, 여러 용도로 사용할 수 있으며, 성능도 뛰어납니다. 하지만 결정 트리는 계단 모향의 결정 경계를 만듭니다. 다시 말해, 축에 수직인 경계를 만드는데, 이 때문에 회전에 민감합니다. 이런 문제를 해결하는 한 가지 방법은 훈련 데이터를 더 좋은 방향으로 회전시키는 PCA 기법을 사용하는 것입니다.
또 다른 점은 훈련 데이터에 있는 작은 변화에도 민감하다는 것입니다. 그리고 사이킷런에서 사용하고 있는 훈련 알고리즘은 확률적이기 때문에(각 노드에서 평가할 후보 특성을 무작위로 선택합니다) 같은 훈련 데이터에서도 다른 모델을 얻게 될 수 있습니다. 다음 장에서 보게 될 랜덤 포레스트는 많은 트리에서 만든 예측을 평균하기 때문에 이런 불안정성을 극복할 수 있습니다.
저희는 6단원에서 결정트리 모델의 사용방법과 이론을 배웠습니다. 다음 단원에서는 랜덤 포레스트 모델을 살펴보도록 하겠습니다.